
How do you decide what to A/B test?
If you’re like most people, you probably do one of two things. You either look through your site and find things you think you could improve, or you Google search “A/B test ideas” to see what other people are doing (and then make a list of tests that sound good).
The problem is neither of those methods work very well. Why? Because they’re based on guesses and (other people’s) opinions instead of your own data-driven research.
Rather than throwing things at the wall to see what sticks, what you need is a systematic process to help you identify where your biggest issues are—and prioritize what to fix first—so you can start running experiments that actually move the needle.
In this article I’m going to show you 7 different ways you can gather data that will help you figure out what’s happening on your site, where users are getting stuck, and why. So throw out your random list of A/B test ideas and let’s get started.
1. Web analytics
The first step is to find the leaks in your funnel. Where’s your site losing money? Where’s the flow stuck? Where should you start optimizing?
You need to identify specific pages (i.e. product pages) and steps in the funnel (i.e. create a free trial) where your visitors are dropping off instead of taking the action you want them to take.
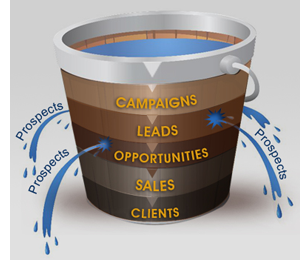
Photo Source: Daniel Matishak
Peep Laja, founder of ConversionXL, has written at length about how to identify these pages. Go into Google Analytics (or whatever tool you use) and dig into each of these reports:
- User flows
- Funnel performance
- Conversions per browser
- Conversions and bounce rate per device
- Pages with high traffic & high bounce rate
- High traffic & low converting landing pages
- Which screen resolution boosts bounce rates?
- Pages with high traffic & slow load speed
- Conversions per traffic source
- Analyze new vs. returning visitors
2. Mouse tracking Analysis
Mouse tracking lets you record what people on your site do with their mouse, and this can give you insights into where visitors are paying attention. Red indicates a lot of action, and blue means no action.
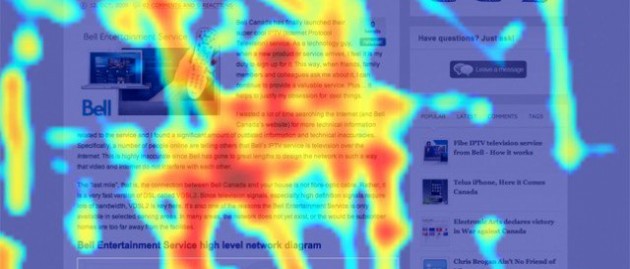
Photo Source: ConversionXL
There’s a bunch of different mouse tracking tools that give you different kinds of data.
- Click maps — these are visual representations of where people have clicked on a specific page. Crazy Egg is a great tool for this. What makes click maps helpful is that they show you what people are clicking on most frequently. They can also show you if people are clicking on non-links (because they think it’s a link).
- Attention maps — these show you which areas of the page are being displayed the most in the user’s browser (taking different screen sizes into account). Session Cam is a solid tool with an attention mapping feature. What makes this useful is that it can help you determine whether the most important pieces of information are in the area that’s visible to most of your users.
- Scroll maps — these show you how far down the page people scroll. What makes this so useful is that it will help you make sure your most important content is on the part of the page that’s going to be seen by the greatest number of users. Mouseflow is a good tool for this.
It’s important to note that just like in A/B testing, you need to make sure you have a large enough sample size. Otherwise you won’t be able to trust the data. So make sure you get at least 2000 page views per screen.
3. Form analytics
Imagine if you knew exactly which form field people hesitate the most to fill out, which field they left blank even though it was required, and which field caused the most error messages. That’s exactly what tools like Inspectlet can tell you. They give you performance data for every single form field.
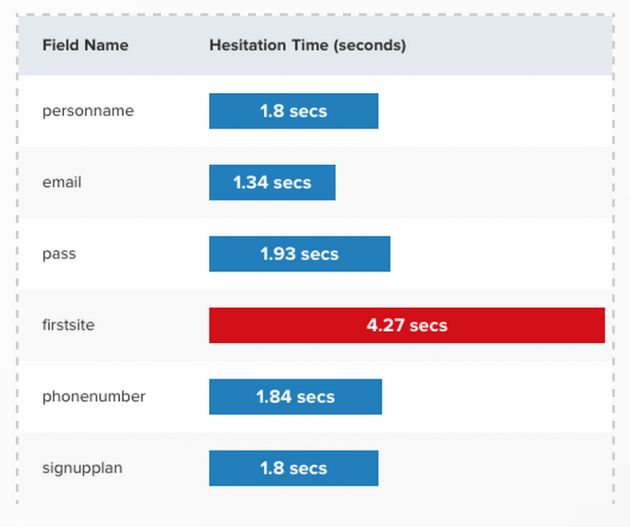
Photo Source: Inspectlet
This level of insight is so useful because it tells you exactly where the problem is, so you can run tests to figure out the best way to address it. If you don’t have any data on your form fields, you’re just guessing. And even the best optimizers only guess right about 60-70% of the time, which is hardly better than a coin toss.
4. On-page surveys
Using on-page survey tools like Qualaroo are a great way to find out why people aren’t converting. Not everyone’s going to fill it out, but you’re going to get some really interesting data here that will inform the kinds of tests you should be running.
Look what’s happening in the screenshot below. It’s a little pop up that you can put on any page of the site, it doesn’t get in the way (like those annoying exit intent pop-ups), and it’s a great way to get feedback.
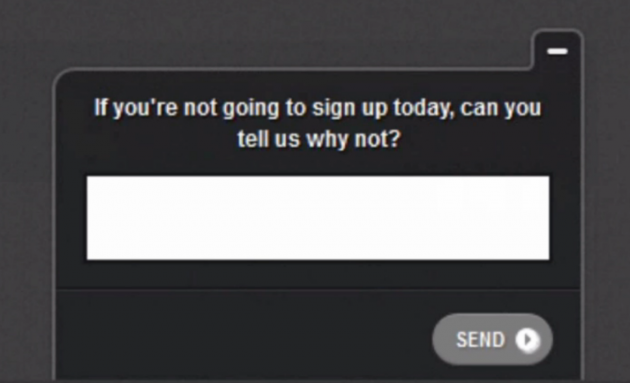
So if you want to find out what’s stopping people from converting, ask them. Put Qualaroo on a page and ask visitors, “If you’re not going to sign up today, can you tell us why not?"
The example above is a good question for your create an account page, but you’ll have to ask different questions depending on what page you place your survey. Here are a few things to keep in mind when you’re trying to figure out what question to ask:
- One page, one purpose — Every page on your site has one job. What’s the #1 most important action you want people to take on this page?
- Learn about friction — Come up with a question that asks about the friction (i.e. the fears, doubts, and hesitations they’re experiencing) that’s preventing them from taking that action.
5. Chat transcripts
If you have live chat on your site (like SnapEngage), dig into your transcripts. What makes this so useful is that people are reaching out on your site and asking for help. They usually chat in with frustrations and confusion, and that can give you insight into things you can fix.
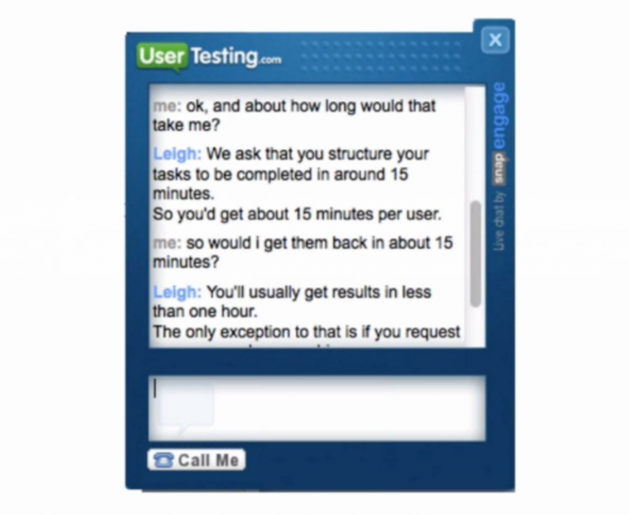
You can put live chat on your pricing page, create an account page, homepage, services page, support page, whatever page you want. And you’re going to get really specific feedback on each of those pages.
You might see that people are really confused on one particular page, which will give you really good A/B testing ideas for it.
6. User testing
In a nutshell, user testing means observing people interact with your website while they speak their thought process out loud. Basically, you have someone go to your website and ask them to do a few tasks as they comment about their experience. What makes this so useful is that you can see and hear where people get stuck, confused, and frustrated.
You can use a tool like ours where you enter your test online and you get a video back in an hour, but you can also do it in person. You can go to a coffee shop, you can ask your friends and family, you can do it in a lab. There’s many ways to to watch people use your stuff.
Here are three specific user test ideas that are guaranteed to find places where people run into issues:
- Send 3 users go through your funnel
- Send 3 different users to your competitor’s site
- Send 3 different users to one of the HUGE companies in your space
If you do nothing else, run a free test on Peek. All you have to do is enter a website URL or app name, and in about an hour you get a video back of someone using your site. You won’t get to tell the tester what to do (i.e. add an item to your shopping cart), but at the very least you’ll get a 5 minute video of someone using your site. And I can almost guarantee that you’ll see people stuck and confused on things that you didn’t think of.
7. User session replays
A user session replay anonymously records videos of your visitors as they use your site, allowing you to see everything they do. It’s kind of like user testing, but without a test script or audio.
This is useful because you get to watch your actual visitors interact with your site and risk their real money. Observe how people fill out forms on your site. And try to find the difference between users who convert vs. those who don’t. Inspectlet is a great tool for this.
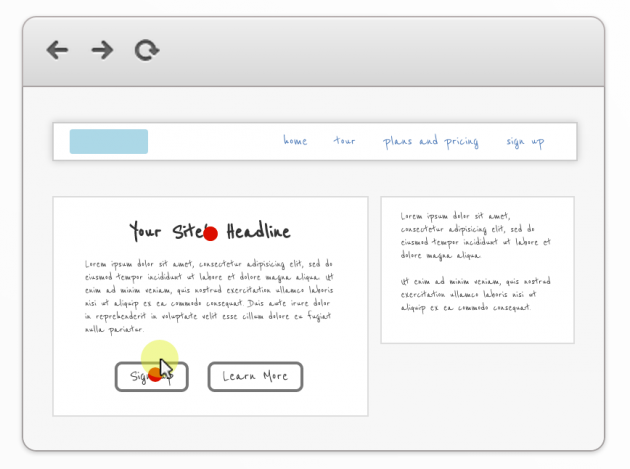
Photo Source: Inspectlet
Bonus: sales & support teams
Your sales and support teams are also great resources because they’re both speaking to customers and prospects on a regular basis. Go talk to people on both of those teams and ask them this question. You're bound to turn up a few recurring issues:
What are the common questions that you’re hearing?
What to do once you’ve collected all this data
Okay, so you've generated all of this quantitative and qualitative data…. what now? Well, at this point you’ll have identified a big list of issues. The next step is to figure out which issues you should work on first.
Prioritize based on these criteria:
- Which issues are affecting the largest number of visitors?
- Which issues have the biggest upside? In other words, which fixes will drive the largest lift in conversion and revenue?
- Which fixes are going to require a lot of (engineering) resources to address?
Eventually you'll tackle all of the issues. But to get started you want to focus on high impact, high opportunity fixes that aren’t going to take months to implement.
How to experiment
Once you have a prioritized list of issues to work on, it's time to run your experiments within a clearly defined process. Here’s the A/B testing framework we use at UserTesting. You can take it, use it, and tweak it to your needs. You don’t have to use it word for word; do whatever is best for your team:
- Test objective — Before you run any A/B tests, write down the answer to this question in 1-2 sentences: “Why are you running this test?”
- Hypothesis — Turn the insights from your data into an educated guess about what you think the results of a specific design change will be. For example, if we do this, then that will happen, because of these assumptions.
- Opportunity Size — If this test works, what’s the total impact you can expect to see over a year?
- Time to test — How long will it take to run this test and get a big enough sample size? (Here’s a sample size calculator to help you find that number).
- Likely scenarios — Write out the three scenarios that you think are most likely to happen.
- Run A/B test — Run your split test and make sure you get a large enough sample size to achieve statistical significance before you declare a winner or loser.
- Next steps — After you get the results from your test, consider what you should do next. If it’s a big success, how can you expand it? What are similar campaigns you can run that will get you similar results? If it was a big failure (and that’s okay, a lot of tests are) then what can you learn to run better tests in the future?
- What worked & what didn’t — It’s important to take the time to consider all the work that you’ve done. So what did you learn? What are you gonna do different on the next test?
Conclusion
A quick Google search for “A/B test ideas” turns up 295 different ideas. What most of us do is we write down our favorites on a list, and choose the one that sounds the best. Once we run that test, we choose the next one from our list that sounds good.
Picking randomly like that isn’t going to get us the big wins we’re looking for. Using a data-driven process can help you generate a list of the biggest issues on your site, prioritize which ones to work on first, and run experiments that really move the needle.
The purpose of your process should be this: to find out where your website is leaking money and why people aren’t converting, so you can fix it. That might sound obvious, but it’s often the simplest things that make the largest impact.
Insights that drive innovation
Get our best human insight resources delivered right to your inbox every month. As a bonus, we'll send you our latest industry report: When business is human, insights drive innovation.

Spencer Lanoue is a marketer who helps UX designers, PMs, and marketers make things people want.