
Using rating scale questions in your UX research

In a previous post, Streamline your UX research with customer experience analytics, we discussed the overall benefits and guidelines that UserTesting’s Research team keeps in mind as they incorporate survey-style questions into their studies. One tool they really like to use—and recommend you do, too—are rating scale questions.
There are a lot of best practices to keep in mind for effective UX research questions. The good news is, that it’s not as hard to design effective rating scale questions as you might think. Keep reading to learn how to get the data-backed support for the qualitative findings you need.
What is a rating scale?
Rating scale questions gather answers that represent a range of choices along with particular themes, like satisfaction level, how likely a respondent is to do something, and the extent to which a respondent agrees with a particular statement.
Here are a few examples:
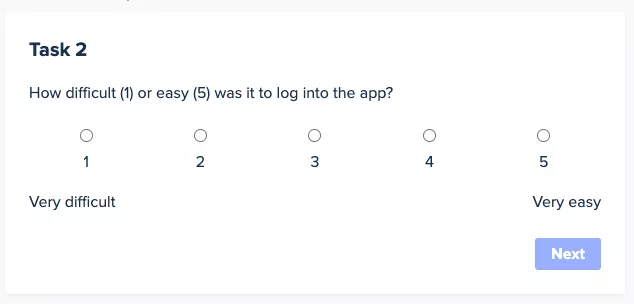
- How difficult (1) or easy (5) was it to log in to the app using Facebook? (1 = Very difficult, 5 = Very easy)
- How unlikely (1) or likely (5) would you be to recommend this game to a friend? (1 = Not at all likely, 5 = Extremely likely)
- How cluttered (1) or organized (5) do you consider the home page? (1 = Cluttered, 5 = Organized)
- How untrustworthy (1) or trustworthy (5) do you consider the site? (1 = Not at all trustworthy, 5 = Entirely trustworthy)
- How disinterested (1) or interested (5) are you in purchasing boosters for this game? (1 = Not at all interested | 5 = Extremely interested)
- Please rate your agreement with the following statement: "I understand what I can do on this site." (1 = Strongly disagree | 5 = Strongly agree)
Why use a rating scale?
Rating scale questions help you quantify abstract or intangible concepts with approximate answers constrained to a single, logical value set (e.g., very likely to not at all likely, 1-7, 1-5).
As the most utilized type of metric question, rating scale questions:
- Give you the easiest indications of user highs and lows
- Provide information about respondents’ attitudes, behavior, and responses to your product or service
- Result in quantitative data you can use to create charts and graphs that visually convey your survey results
Types of rating scales
There are four main types of rating scales.
Ordinal scales
Ordinal scales deliver answer sets that occur in a logical, systematic order and have a relational link. For example:
- Ask respondents to use a scale of 0-10, where 9-10 identifies the respondent as a “promoter” to denote how likely they are to refer a company/product/service to someone else (i.e., a Net Promoter Score).
Likert scales
Likert scales assess the degree to which a respondent agrees or disagrees about a given statement. For example:
- Ask respondents to use a 1-5 scale where 1 represents “I strongly disagree” and 5 represents “I strongly agree” to communicate how strongly they agree or disagree with a particular statement.
Semantic differential scales
Semantic differential scales gauge emotional attitudes toward a topic by asking respondents to rate a product, company, service, etc. within the frames of a multi-point rating option representing opposite adjectives at each end. For example:
- Ask respondents to use a multipoint spectrum where one end represents “Extremely dissatisfied” and the other end represents “Extremely satisfied” to indicate their beliefs about a product/company/etc.
Interval scales
Interval scales feature answer sets where each interval represents a deeper meaning, not just an ordered grouping. For example:
- Ask respondents to use a 1-5 ordered list of numbers where 1 represents how “Least likely” and 5 represents how “Most likely” they are to complete a specific action.
How to make the most of your rating scale questions
Now that you understand the basics, here are some tips to help you get the most out of the rating scale questions you write.
1. Clarify the endpoints of your rating scale
Rating scales are highly adaptable and can be used to measure many different things—but only if the people taking your test understand what you’re asking them to measure. So make sure your rating scale involves two ends of a spectrum (which you effectively communicate) and assign clear labels to each one.
2. Include both sides of the rating scale in your question, as well as in the endpoint fields.
If you ask users how easy it was to accomplish something, their inclination is to say it was easy—even if they struggled—because people are naturally eager to please. You can avoid introducing bias by making sure you include both endpoints in your question (e.g., the good/the bad, how hard/how easy, etc.).
Pro tip: If you include both sides of the scale in the body of your question, you’ll also reinforce the endpoints you’ve defined and lower the chance a user will misread your question.
3. 1 should always be the “pain” point of the rating scale, and 5 should always be the “positive” point
We tend to consider low numbers to be bad and high numbers to be good. Looked at another way: we automatically associate higher numbers with good news and lower numbers with bad news. So do yourself — and your users — a favor, and always label 1 as the “pain” point, and 5 as the “positive” point.
Pro tip: If you set up a rating scale question and realize the two endpoints are neutral and/or the positive point is right in the middle, consider turning it into a multiple-choice question. Instead of asking users to rate something on a scale from (1) “Too small” to (5) “Too big,” for example, change the question to a multiple-choice format featuring three answer options — “Too small,” “Just right,” and “Too big.”
4. Use the optimal number of points on your rating scale.
You want respondents to differentiate their answers as much as possible, but you also don’t want to provide so many points that your rating scale becomes confusing or unreliable. It’s a delicate balance. So here are two tried-and-true guidelines that can help.
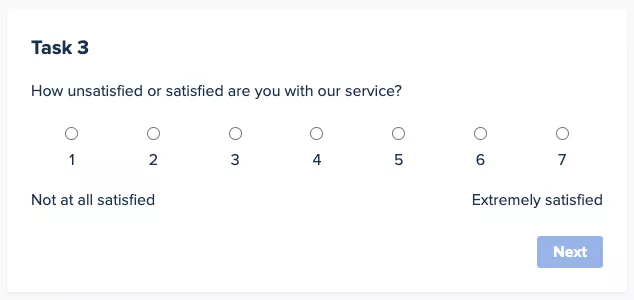
For ideas that range from positive to negative, use a 1-7 point scale that includes a middle or neutral point.
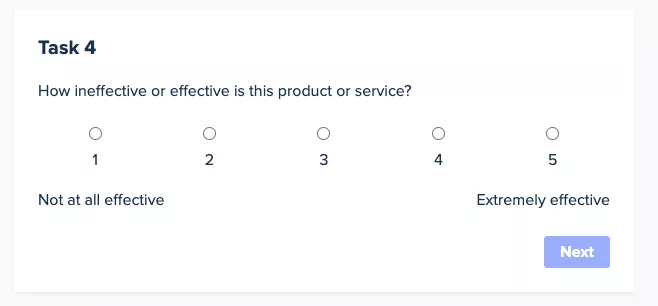
And for ideas that range from zero to positive, use a 1-5 point scale.
Why 5-point and 7-point scales are most common
5-point scales are popular because they strike a balance between giving respondents enough options to express their feelings or opinions and not overwhelming them with too many choices. This scale typically includes two positive options, two negative options, and a neutral/middle option. It’s straightforward and helps to prevent respondent fatigue, which can lead to more reliable data.
7-point scales provide a finer gradation, which can be useful when you need more sensitivity in responses. They can capture slight variations in attitudes or opinions more effectively than fewer points. This scale is advantageous when the distinction between response categories needs to be more nuanced, allowing for a more precise measurement of respondents' feelings or opinions.
Choosing between a 5-point scale and a 7-point scale
The choice between these scales depends largely on the level of granularity needed in the data and the specific context of the survey:
- When to use a 5-point scale: This scale is suitable for most general surveys where the goal is to get a clear indication of preferences or opinions without requiring too fine a distinction between degrees of agreement or satisfaction. It's easier for respondents to make a decision with fewer options, which can lead to quicker completion rates and lower dropout rates. This scale is ideal for broader audience surveys where the depth of analysis on each individual question isn't as critical.
- When to use a 7-point scale: Opt for a 7-point scale when your analysis requires a deeper dive into a more subtle range of opinions or emotions. This scale can be particularly valuable in specialized research settings where slight differences in responses could have significant implications, such as clinical research, detailed market analysis, or advanced product feedback surveys. The additional points allow for a more detailed segmentation of responses, providing richer data that can enhance the insights derived from the survey.
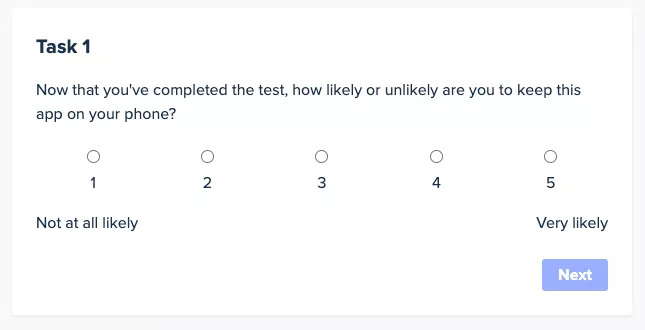
5. Measure one element or action at a time with your rating scale
Imagine you easily download a new app and then spend seven extremely frustrating minutes trying to figure out how to create a new account.
Then you’re confronted with the following question:
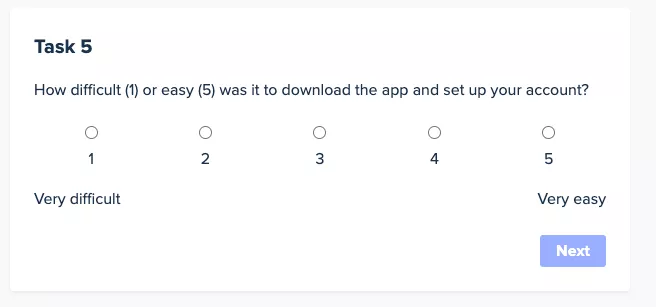
By asking about two different elements—downloading the app and setting up an account—this question is trying to measure two distinct elements. And it will yield invalid, inconclusive, and misleading results So be sure to write separate, individual rating scale questions for each task your users perform.
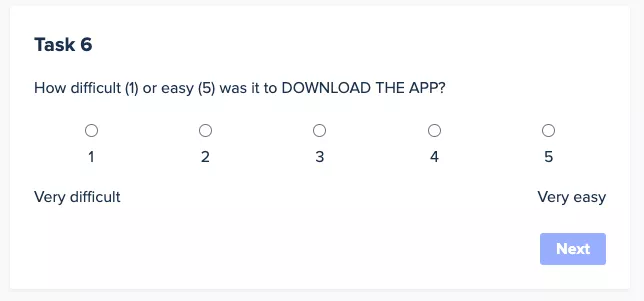
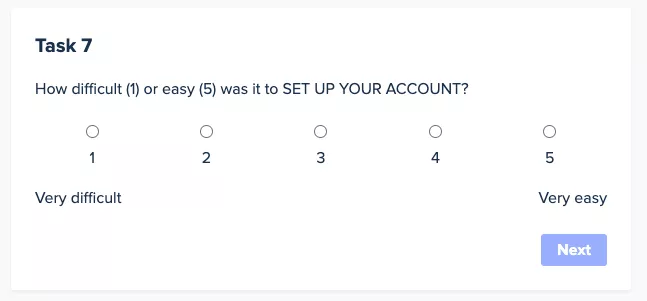
Pro tip: If you’re worried about users mistaking the second question as a duplicate, you can always capitalize the task you’re asking users to rate, for additional emphasis:
6. Gain deeper context by allowing additional information in your rating scale.
Careful design means your user research questions can provide deeper understanding of your customers' contexts. Allowing respondents to expand upon their rating answers can help you understand why they answered the way they did. It can also alert you to problems and opportunities with your offering. So include a free-text answer box underneath each rating scale question where respondents can input any additional information they want to share about why they chose their answer.
How to interpret data from rating scale questions
Interpreting data collected from rating scales involves several statistical measures that can provide valuable insights into the opinions or behaviors of your survey respondents. You'll likely be familiar with mean, median, and mode, but just in case, let's take a quick refresher course. understanding how to calculate and interpret these measures can help you make informed decisions and identify trends in your data.
Understanding mean, median, and mode
Mean (Average):
- Calculation: The mean is calculated by adding all the numeric values from the rating scale responses and dividing by the number of responses. For example, if your rating scale is from 1 to 5 and you receive the responses 2, 3, 5, 4, and 3, the mean would be calculated as (2+3+5+4+3)/5 = 3.4.
- Usage: The mean is useful for determining the overall tendency or central tendency of the data. It gives you a general idea of how respondents feel about a question overall. It's particularly useful when the data distribution is symmetric and there are no extreme values (outliers) that might skew the average.
Median:
- Calculation: The median is the middle value in a list of numbers sorted in ascending or descending order. If there is an odd number of observations, the median is the middle number. If there is an even number of observations, the median is the average of the two middle numbers. For example, with responses of 2, 3, 3, 4, and 5, the median is 3. With responses of 2, 3, 4, 5, the median is (3+4)/2 = 3.5.
- Usage: The median is valuable in understanding the central point of a data set, especially when the data set may have outliers that could distort the mean. It represents the point at which half of the responses are above and half are below, providing a robust measure of central tendency.
Mode:
- Calculation: The mode is the number that appears most frequently in your data set. For instance, if the responses are 1, 2, 2, 3, 4, then the mode is 2 because it appears more frequently than any other number.
- Usage: The mode is particularly useful when it's important to identify the most popular choice or opinion among respondents. It's helpful in situations where the most common response is more valuable than the average response, such as identifying the most preferred product features or the most common issues in customer service.
Applying these measures to analyze rating scale data
Identifying trends: By tracking changes in the mean and median over time, you can identify trends in attitudes or satisfaction levels among your respondents. For example, if the mean satisfaction rating consistently increases after certain changes or improvements, this can indicate a positive trend in customer perception.
Making informed decisions: Understanding the mode can help decision-makers focus on the most common needs or preferences of their audience. For instance, if the mode of a product feature rating is low, it might indicate a need for improvement in that area.
Analyzing response distribution: Comparing the mean, median, and mode can provide insights into the distribution of your data. If the mean and median are close but the mode is significantly different, this might suggest a skewed distribution or the presence of outliers. This can lead to deeper investigations into why certain responses differ from the general trend.
By effectively calculating and interpreting these measures, you can gain a comprehensive understanding of your rating scale data. This not only helps in assessing the current state of respondent attitudes or behaviors but also aids in planning future actions based on informed, data-driven insights.
When should I avoid rating scale questions?
As you can tell, rating scales are a versatile tool, but there are times you'll want to avoid this approach universally applicable to all types of survey questions. Understanding when and how to use rating scales can greatly enhance their effectiveness
Best uses for rating scales
Rating scales are ideal for questions that seek to measure:
- Intensity or frequency: Questions that aim to gauge how often something occurs or the intensity of a feeling are well-suited to rating scales. For example, "How often do you use our product?" with options ranging from "Never" to "Daily."
- Opinions or attitudes: When you want to understand how strongly people feel about an issue, rating scales can quantify these attitudes. An example might be, "How much do you agree with the following statement? 'The customer service is satisfactory.'" Options could range from "Strongly disagree" to "Strongly agree."
- Performance or satisfaction: To assess satisfaction levels or the performance of a service or product, rating scales provide a clear metric. For instance, "How satisfied are you with our service?" with choices from "Very dissatisfied" to "Very satisfied."
When other types of questions are more effective
While rating scales are useful, some survey questions require different approaches:
- Binary yes/no questions: These are effective for straightforward questions that require a definitive answer, not a measure of degree. They are particularly useful for filtering questions or when a simple yes or no is sufficient to capture the necessary data. For example, "Have you ever purchased a product from our website?" simply requires a yes or no answer.
- Open-ended questions: When you need detailed feedback or a deeper understanding of a respondent's thoughts and feelings, open-ended questions are preferable. They allow respondents to express themselves in their own words, providing richer qualitative data. For instance, asking "What did you like most about our product?" permits a wide range of expressive responses that could uncover insights not captured by a scale.
- Multiple-choice questions: For questions where there are several distinct answers but only one needs to be chosen, multiple-choice is appropriate. This type of question is particularly useful when the answers are mutually exclusive and comprehensive. An example might be, "Which of the following age groups do you fall into?" with a list of age ranges provided.
- Ranking questions: When you want to understand preferences in relation to each other rather than in absolute terms, ranking questions are more suitable than rating scales. Respondents can order a list of options based on preference, importance, or frequency. For example, "Rank the following features in order of importance for our next product update," with several features listed for prioritization.
Choosing the right type of question format is crucial for gathering meaningful data in surveys. Rating scales are highly effective for capturing the degree of respondents' feelings or behaviors and are best used when nuances in intensity or frequency need to be quantified. However, for clear-cut decisions, qualitative insights, or comparative preferences, other question types like binary yes/no, open-ended, multiple-choice, or ranking questions might be more appropriate. By aligning the question type with the goal of your survey, you can optimize the collection of actionable and accurate data.