Customer experience metrics: a brief guide on how to measure CX

Forrester’s CX Index found that 72% of companies say improving customer experience is a priority. But less than 1% of organizations deliver an excellent experience for their customer. Tracking and benchmarking customer experience metrics is one way companies can start improving their CX.
Executives are becoming more and more aware of the importance of great CX, making the task of figuring out where to start making improvements—and how to measure customer experience—a top priority.
Janelle Estes, VP, Strategic Research Services at UserTesting notes,
We've seen a shift in how executives and leaders invest in the customer experience. Those that are providing the best customer experiences are making significant investments to place the customer at the center of every decision they make.
A great place to start is by measuring your key customer experience metrics. But when it comes to a qualitative concept like CX, how exactly do you measure it? That’s the question that we’ll address in this article. We’ll also cover common metrics that companies with mature CX practices use to measure customer experience.
Customer Experience Metrics
- Net Promoter Score
- Customer Satisfaction
- Customer Effort Score
- Customer Churn Rate
- First Response and Average Handling Time
1. Net Promoter Score (NPS)
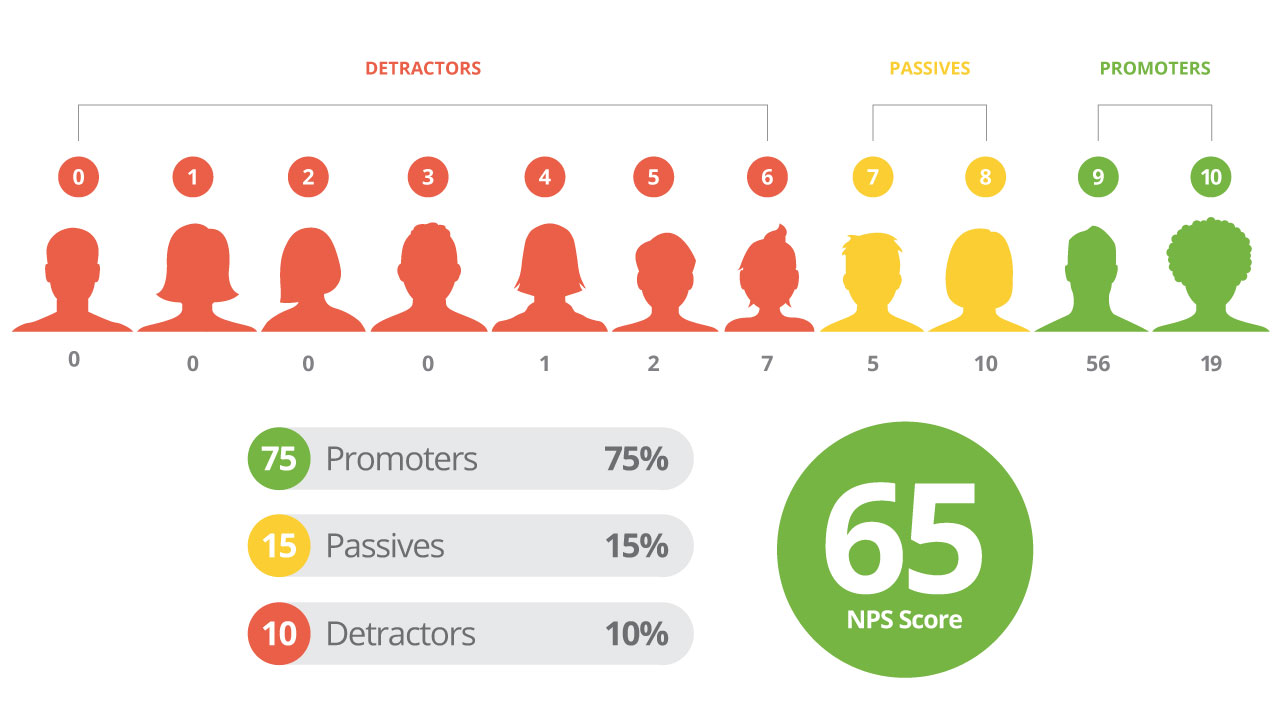
NPS is the percentage of your customers who would—or wouldn’t—recommend your company to their friends, family, or colleagues.
It’s typically measured with a customer survey that asks the customer, “How likely are you to recommend this business to a friend or colleague?” Customers rate your company on a scale from 0-10. Your NPS is calculated by subtracting the Detractors from the Promoters.
Source: ReviewTrackers
Pro tip from Jay Baer, Author of Hug Your Haters, Founder of Convince and Convert:
Customer experience is all about expectation management. Great customer experience occurs when you exceed customer expectations in a palpable way. Poor customer experience occurs when you fail to meet customer expectations.
2. Customer satisfaction (CSAT)
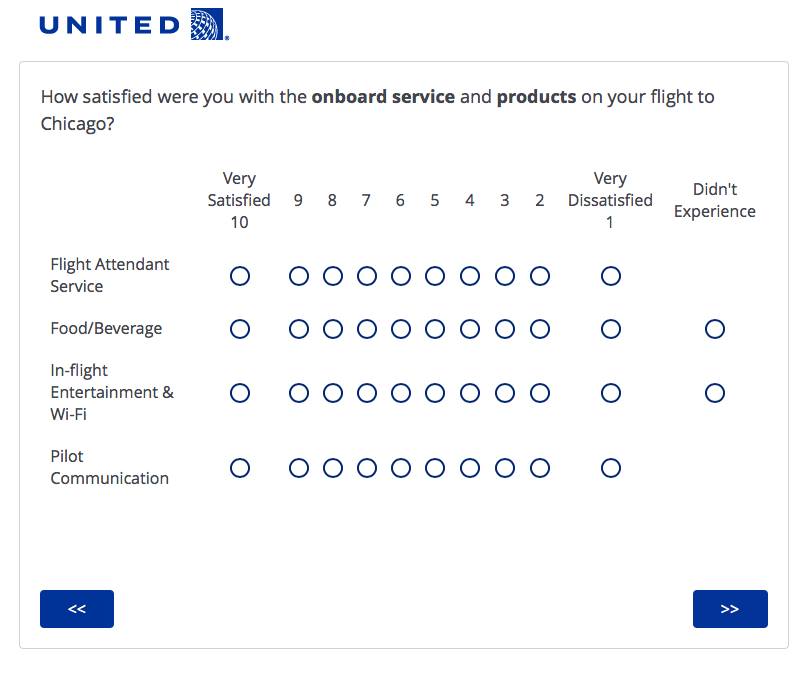
CSAT is the average satisfaction score that customers rate a specific experience they had with your organization—such as getting an answer from customer support or returning a product.
Customer satisfaction is measured by sending customers an automated survey asking them to rate their level of satisfaction with the interaction on a scale of “Not satisfied at all” to “Very satisfied.”
Source: imgur
Pro tip from Helen Casewell, UX Research Manager at VoxGen:
The key benefit I’ve found with CSAT is that it’s based on a here and now reaction to a users’ satisfaction with a product or service (we try and get a CSAT score within 30 minutes of a product or service being used), whether that be through a website, IVR, smartphone or some other channel.
3. Customer effort score (CES)
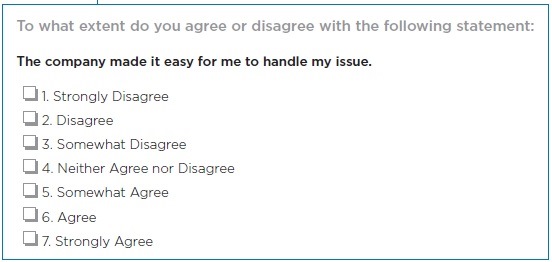
CES helps you determine the effort required by your customers to accomplish a task, like getting a support request handled or finding the product they were looking for. It’s typically measured by sending customers an automated post-interaction survey asking them to rate a specific statement on a defined scale.
The statement will depend on the interaction they just completed. For a customer support interaction, for example, you might ask “How much effort did you personally have to put forth to resolve your issue?” And have them rate the interaction on a scale ranging from “Very low effort” to “Very high effort.”
If you’re measuring how easy or difficult it is for customers to find the product they were looking for, you might ask them to rate the statement “The company made it easy for me to find the product I was looking for” on a scale ranging from “Strongly disagree” to “Strongly agree.”
Source: CEB
Pro tip from Matthew Dixon, Karen Freeman, and Nicholas Toman from Corporate Executive Board:
Customers resent having to contact the company repeatedly (or be transferred) to get an issue resolved, having to repeat information, and having to switch from one service channel to another (for instance, needing to call after trying unsuccessfully to solve a problem through the website).
4. Customer churn rate
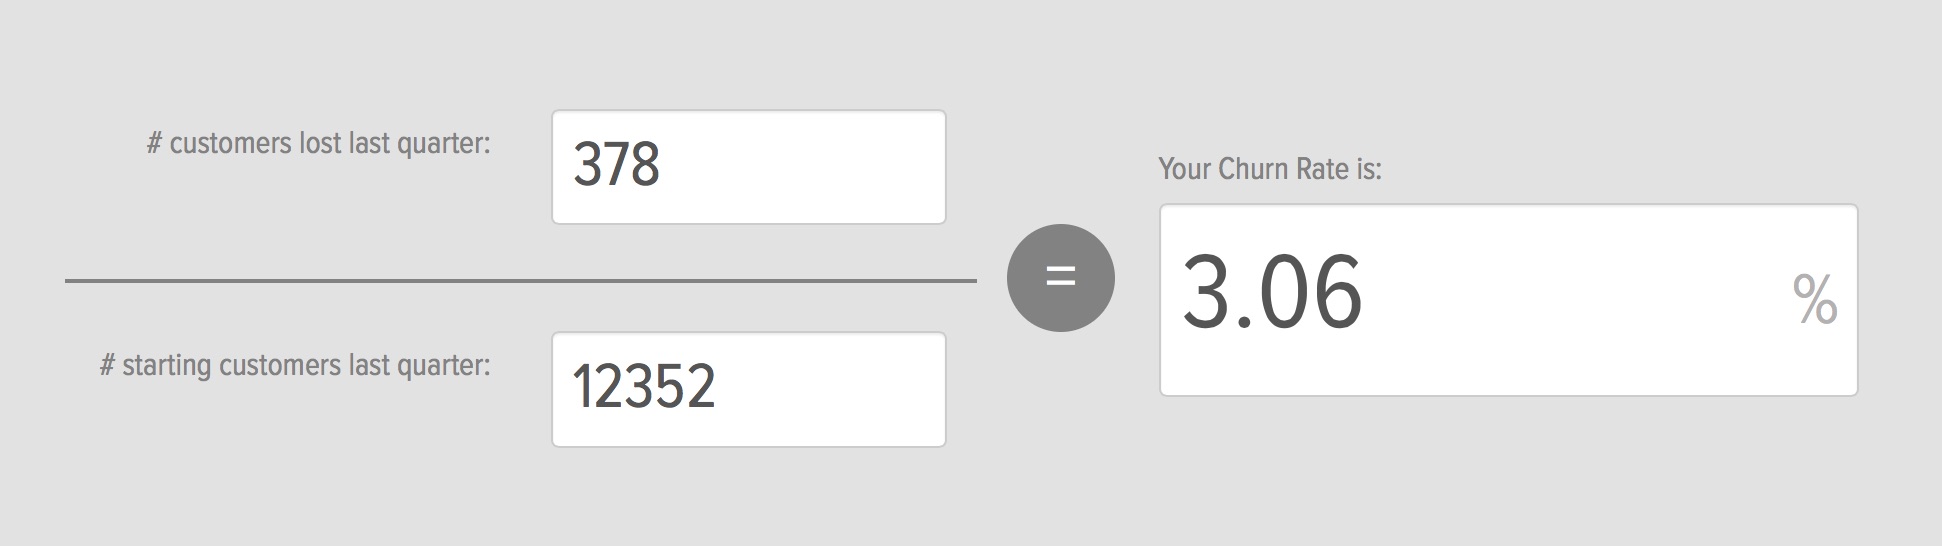
Churn rate is the percentage of customers who either don’t make a repeat purchase (for transaction-based businesses) or cancel their recurring service (for subscription-based businesses).
You can calculate this metric by dividing the total number of lost customers by the total number of active customers for any given period.
Source: churn-rate.com
Pro tip from the RJ Metrics team:
The key difference for non-subscription-based ecommerce companies is that they need to clearly define what constitutes a churn event. For example, if a company knows that most of their customers who will make a repeat purchase do so within 90 days, they may choose to mark any customer who has not made a purchase in that time period as being ‘churned'.
5. First response and average handling time
First response time is the average amount of time it takes for a customer to get an initial response to their support issue. This is typically measured by taking the average amount of time from when your customers first open their support tickets to the time that they receive their first response.
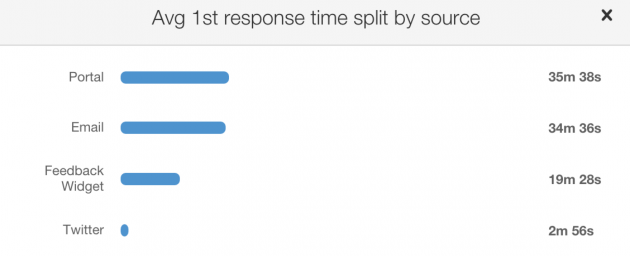
Source: Freshdesk
As its name implies, average handling time is the average amount of time it takes to resolve a customer support interaction from start to finish. This metric includes time spent interacting with customers on calls, email, chat or anything else—as well as the time between interactions.
Average handling time is typically measured by taking the average amount of time it takes to fully resolve a customer issue—starting from when the customer first initiates the interaction all the way to the point when the issue has been successfully resolved.
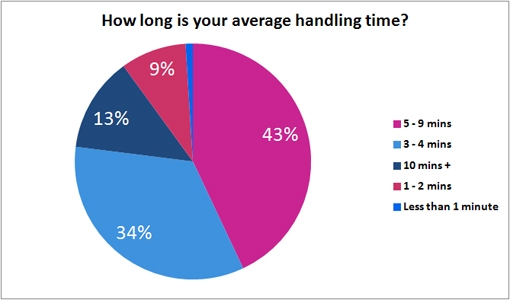
Source: CallCentreHelper
Pro tip from Amar Zagorica, Customer Service Manager at HelpJuice:
How many interactions between the customer and company staff are necessary to resolve the issue? The best answer is 0, if you can avoid issues, but realistically it’s 1. If it takes five interactions, on average, in order to solve an issue, it could mean that the customer is not being put in touch with the right individual to solve the problem. This is wasting the customer’s time and your company’s time.
How do you measure UX and CX improvements?
After a team has gathered all the quantitative metrics they feel appropriate, what happens next? The metrics, on their own, won’t give an organization the full picture of the customer experience.
As a result, many professionals in customer-centered organizations find themselves asking this crucial question:
How do we make sure that when we make improvements to UX/CX, it results in conversions and sales?
This is where qualitative insights like user tests and customer interviews will provide valuable human insights to round out the ‘why’ behind the metrics. Start by benchmarking using any or all of the above metrics, then measure again after gathering qualitative insights. Improvements in these metrics, when tied to UX/CX improvements is a key strategy for proving the value of UX/CX research.
How do you measure CX?
Every business is different. There’s no single metric that will work for every organization in every industry. Whatever you decide on, make sure that you measure the things that are most important to your customers, and that you can draw actionable insights from and put to use right away. Relying on customer metrics, paired with human insights, will give you a holistic view of the customer journey, enabling you to continually improve your CX.

Are you an insight seeker?
Join UX, research, and design leaders in London to push your craft further.