
The most common questions people ask about UserTesting’s QXscore™

Executives want clarity. Teams want direction. Customers want better experiences. QXscore™ brings all three together by giving organizations a clear, unified way to measure digital experience quality.
In this post, we’ll explore the most common questions teams ask about QXscore—what it measures, how it works, and why leading brands rely on it to benchmark journeys, validate improvements, and communicate progress in a way everyone can understand.
What is the QXscore™?
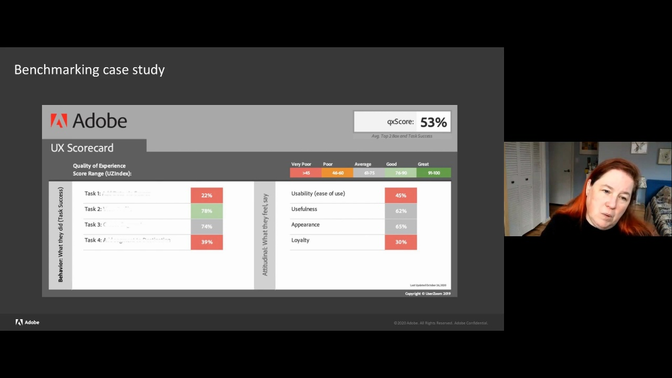
QXscore™—short for Quality Experience Score—is a standardized, holistic metric for evaluating digital experience quality on a 0–100 scale. It blends what users do (behavioral data like task success and time on task) with what they feel (attitudinal input like ease, trust, appearance, and loyalty).
By unifying both sides of the experience, QXscore gives teams a complete picture of customer performance and sentiment—a clarity that is often missing when relying on a single metric.
“Companies that deliver the best experiences win. Period,” said Tom Charteris, Principal Solutions Consultant at UserTesting, in his on-demand webinar “Benchmarking excellence in UK retail: Are you standing out or blending in?”
QXscore helps teams see exactly what “winning” looks like.
This metric was created to give teams a meaningful, repeatable way to quantify user experience across product lines, channels, and competitors—solving the problem most teams face: many UX metrics exist, but few are both simple and executive-friendly.
On-Demand Webinar
Benchmarking excellence in UK retail: Are you standing out or blending in?
Join us for this exclusive webinar as we unveil this UserTesting benchmark study, where four of the UK’s top retailers were put to the test.
Why was the QXscore created?
Most organizations track plenty of metrics—conversion rates, NPS, CSAT, time on page, drop-off, and more—but these measures often live in silos. Teams may know something happened, but not why it happened.
This creates major challenges:
- Teams rely on scattered metrics
- NPS alone doesn’t diagnose root causes
- Decisions often come down to opinion, instinct, or the “HiPPO effect” (highest-paid person’s opinion)
Adobe experienced this firsthand. “NPS is valuable for measuring loyalty and measuring people’s attitudes, but it doesn’t really tell you what the people are actually doing in your product,” said Pert Eilers, senior program manager at Adobe. “People would be failing at the tasks and still give us these super high scores.
Brand affinity inflated attitudinal metrics, masking real usability problems. Adobe needed a metric that revealed both sentiment and performance.
Nearly 60% of all executives say they don't have the data they need to prove UX’s impact. UserTesting created QXscore to address this gap.
“You might think you're delivering a great experience. You might think you already are delivering a great experience,” said Caroline Vize, UserTesting’s Director, Solutions Consulting, in her on-demand webinar: Unlocking Success in Premium Digital Banking. “But you might be surprised to hear that customers don’t see it that way. A big part of the customer experience is still missing. … Do you truly know what the gaps in your experiences are for the products that you're working on? Do you have sight of that? Do you understand the whole holistic experience and the journey the customer is going through?”
QXscore was designed to close those gaps with a repeatable, business-ready metric that reflects the real customer experience.
How is the QXscore calculated?
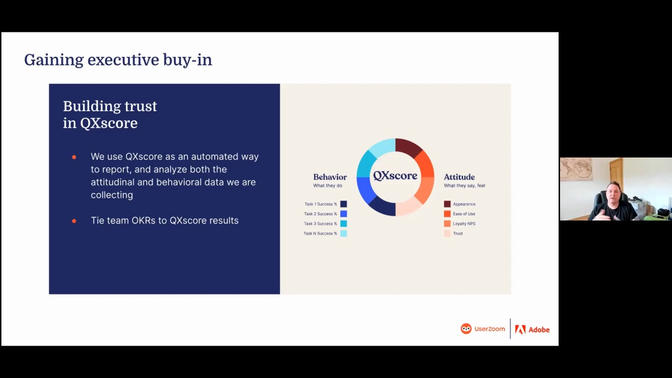
QXscore is built from two complementary components:
Behavioral metrics:
- Task success
- Task time
- Pageviews
- Problems or frustration signals
Attitudinal metrics:
- Ease of use
- Appearance
- Trust and confidence
- Loyalty and likelihood to recommend
These inputs are weighted and combined into a single, easy-to-understand score that makes experience quality simple to compare—across time, across products, and across competitors.
“QXscore gives you crystal-clear answers on what’s going on,” said Michael Grieder, lead researcher at Adobe User Labs.
Why this matters
Unlike standalone metrics, QXscore provides both breadth and depth:
- The overall score communicates quality at a glance
- Component scores reveal where friction, confusion, or sentiment issues lie
- Task-level details show exactly what needs improvement
This layered structure fuels prioritization and accelerates decision-making.
How do I interpret my QXscore?
Interpretation begins with the overall number—but the real value comes from examining score components and trends, Caroline said.
When a score dips or unexpectedly underperforms, QXscore reveals why—highlighting whether the issue stems from clarity, usability, emotional response, or loyalty.
Teams typically ask:
- Is a score of 75 good? It depends on your baseline, industry norms, and competitive landscape.
- Where should we focus next? Component scores (e.g., trust = 67%) reveal targeted opportunities.
- Are improvements meaningful? Comparing scores over time confirms whether design changes achieve their intended impact.
On-Demand Webinar
Unlocking success in premier digital banking
Is your premier banking experience driving loyalty—or creating roadblocks?
Leaders love it because a single score—paired with diagnostic detail—helps them quickly evaluate whether experiences are improving.
“And that's where QX score has been really helpful with us in that we could benchmark a flow, understand its score in simple terms, and then work to improve that score over time,” said Lucas Lemasters, UX research principal at American Airlines, in the on-demand webinar, How QXscore transforms the product development lifecycle “It gives this north star to link all of your usability tests together and create that baseline.”
Expert Insight: Tom Charteris noted that even successful task completion rates may mask underlying issues—QXscore exposes the friction users feel along the way, which is essential for improving long-term loyalty.
How do I add a QXscore to my study?
You can add a QXscore task to any UserTesting test that includes:
- A series of clear, goal-oriented tasks
- Evaluative questions after each task
- A stable participant profile and sample size
- A desire to track performance over time or compare against benchmarks
Think of QXscore as a built-in checklist for what makes a test meaningful, consistent, and comparable.
What types of tests work best for capturing a QXscore?
QXscore is ideal for:
- End-to-end journey evaluations
- Critical task flows like checkout, onboarding, booking, sign-up, or account creation
- Benchmarking studies
- Redesign validation
- Competitive comparisons
Benchmark-style tests, in particular, generate clean, comparable results that organizations can use quarter after quarter.
Banking teams, retail brands, travel companies, and SaaS organizations all rely on QXscore to measure the journeys that matter most to customers.
“It can really reduce the risk of what you're working on, help you drive conversions as well, which is obviously the name of the game,” Caroline said. QXscore “really helps you focus on the customer. You're not having to rely on your own judgment anymore. You can really hear from the customer themselves.”
How should I use my QXscore results?
Teams typically use QXscore to:
1. Identify friction
Whether it’s a confusing menu, hidden pricing, unclear instructions, or an unexpected error, QXscore highlights the moments that break the experience.
2. Prioritize improvements
Higher-impact improvements rise to the surface quickly, supported by both qualitative insights and quantitative results.
3. Validate redesigns
After making changes, teams run QXscore again to confirm the experience has improved.
4. Demonstrate business value
Higher QXscores correlate to improvements in conversion, trust, satisfaction, and loyalty—key KPIs that executives monitor closely.

At American Airlines, QXscore was instrumental in validating redesigns for flights, bookings, and check-in. Lucas Lemasters shares, "When we analyzed our experience for changing and managing a flight, we found several key areas where customers were frustrated. They couldn't find where to put passport information, where to add their loyalty account, where to request a meal, or even where to email an itinerary to themselves. When we went back and changed the concepts, we were able to achieve a 37% increase in customer completion rate across all of those tasks."
That kind of measurable lift helps teams secure buy-in, investment, and momentum.
Can I benchmark my QXscore over time or against competitors?
Teams use QXscore to compare:
- Current vs. past performance
- Desktop vs. mobile
- One product line vs. another
- Their experience vs. key competitors
Competitive benchmarking is especially valuable. For example, in a recent UserTesting study on premium banking, large gaps emerged between banks that believed their journeys were intuitive and customers who disagreed.
Tom Charteris emphasized this in his retail benchmark webinar. “Customers don’t care about your roadmap,” he said. “They care about the best experience available. Benchmarking shows where you stand in that race.”
How does QXscore relate to NPS, CSAT, or SUPR-Q?
Traditional customer metrics are helpful, but incomplete.
NPS captures loyalty. CSAT captures satisfaction. SUPR-Q captures perceived usability and trust.
But none of them combine attitudinal and behavioral data in a single score.
QXscore complements other experience metrics by adding context and diagnostic clarity.
How do I build an ongoing QXscore measurement program?
Teams that see the biggest impact from QXscore tend to follow three steps:
- Establish a baseline. Evaluate your most important customer journeys.
- Benchmark regularly. Track improvement after each major release.
- Tie QXscore to decision-making. Use it as a phase gate. Use it in planning cycles. Use it in OKRs.
Banco Sabadell, for example, mandates a minimum QXscore of 85 for its digital offerings prior to their market release. Setting this benchmark allows the bank to quantify the level of their competitors for the solution they are trying to test or launch.
“Our mandate is to develop digital solutions that not only fulfill our customers’ expectations, but also align with our bank’s esteemed standards,” said Alex de Fuenmayor, DesignOps Lead & Chapter UX at Banco Sabadell. “UserTesting and the QXscore equip us with the critical insights needed to genuinely understand our customers’ preferences, establishing a fact-based standard for decision-making. This allows us to make more informed decisions that enhance customer service across all platforms.”

How do I communicate QXscore findings to stakeholders?
Executives respond best to clear, consistent insights tied to business outcomes. QXscore was designed with this in mind.
Use QXscore to:
- Highlight progress over time
- Connect UX improvements to KPIs (conversion, retention, CSAT, NPS)
- Share a unified metric across departments
- Establish credibility with data-driven leadership
And—most importantly—it tells a compelling story about what customers need and why it matters.
Moving ahead with your QXscore
QXscore gives UX, product, marketing, and digital teams something they’ve long needed: a single, trusted, actionable way to measure digital experience quality.
It blends what users do with how they feel, offering clarity, comparability, and direction.
It supports benchmarking, drives prioritization, validates redesigns, and even fuels ROI modeling.
Whether you’re launching a new product, modernizing an existing experience, or differentiating against competitors, QXscore provides the confidence and clarity to move forward.
Caroline put it best, “It’s not enough to think you’re delivering a great experience—you have to measure it. QXscore shows you where you stand, where you’re behind, and where you need to go.”
Whether you're building a new measurement program or strengthening an existing one, QXscore can become the anchor of your experience strategy.
On-Demand Webinar
How QXscore transforms the product development lifecycle
What if there was a way to measure and optimize designs from the beginning to empower product teams to plan with more confidence and reduce the cost of rework?


